Now let’s look at the charts and data for when the market flattens off and goes sideways.

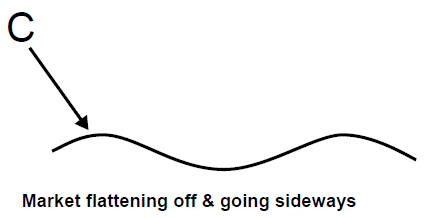
As the market starts to flatten off after an uptrend (point C), the first thing we see is that the out-performance of the most volatile sectors starts to decline. The relative performance of all the different groups starts to close up. There’s no longer such a big difference between the high volatility and low volatility groups.
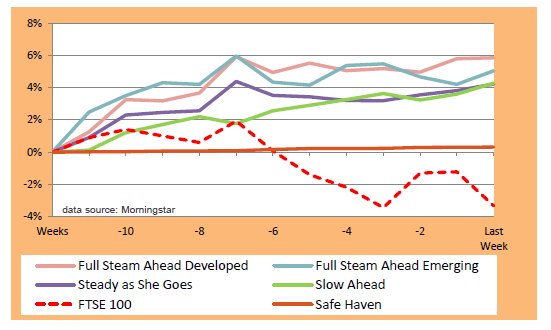
Why? Because the overall direction of the market is flatter, there isn’t a clear movement to be exaggerated by the higher-volatility sectors. They’ve got “less to work with”, as it were. And so the chart of the different groups starts to bunch up, like this:

In this chart we can see two things. Firstly, after the first four weeks the overall trend is pretty much flat for three of the groups – although Slow Ahead (green line) keeps trending upwards.
And secondly, as I just mentioned, the performance of all the groups is bunching together. At the far right of the chart, the four groups (apart from Safe Haven) are all in the 4% - 6% range. This is very different from the previous group chart that we looked at, (see How you can actively respond to the market and make more money), where there’s a much wider ‘spread’ of performance.
At the top of the market, when it’s flattening off, this kind of pattern provides us with all the information we need to manage our risks – so that we aren’t highly exposed if a downturn then ensues.
The gap between the performance of the different groups – high volatility and low volatility – narrows. And therefore it no longer makes sense to be so heavily invested in the high volatility sectors, because they aren’t out-performing the low volatility sectors as much as before. In fact they may not be out-performing at all.
So at this point you start to withdraw your money from the high volatility sectors, and switch it into the lower volatility, safer sectors.
Of course, the thing about a sideways market is that we don’t know which way things are going to go next. Is this a market top, with a downturn coming? Or will the market head upwards? We don’t know.
A small uptrend may be the beginnings of something bigger. Or it may just fizzle out.
Similarly with a small downtrend.

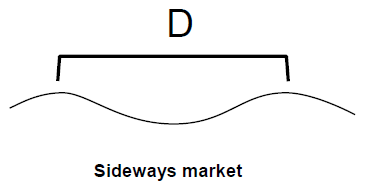
So if a sideways market pattern (D) continues for a while, we just have to keep testing the water.
We use our 4-week minimum period to decide whether a trend is worth putting our money in. We start with a small amount, and if the trend continues, then we can increase our exposure. If it begins to die out, then we simply reduce our exposure or get out and wait for the beginnings of another trend to emerge.
So we play the market – in and out, in and out – until it goes in one direction or the other.
In a sideways market everything we do is a bit tentative. We’re never really committing to anything and it’s difficult for us to make much money, if any. But the fact is, unless we’re continually testing, we’re not going to be in the right place when the big movement up or down comes.
If we’re over-exposed in a sideways market, and it turns into a big downturn, then we’ll lose much more money than we need to. And if we’re under-exposed, and it turns into a big upturn, then we won’t make as much money as we could. We need to keep the right balance.
This is the way we protect ourselves, and are always ready for the next move – by continually adjusting our exposure.
And this is how you really can keep yourself relatively immune from all investors’ greatest fear – a cataclysmic 40% - 50% plunge in the market.
Let’s now investigate big plunges in the market more closely.
Read next > Why a 50% plunge in the market needn’t scare you

Comments
0 comments
Please sign in to leave a comment.